Al Futtaim Automotive

A unified, single source of truth for business performance

We have worked with Al Futtaim Automotive since our 2011 inception. Since then, we have
worked on multiple exciting projects and more recently briefed on their unique challenge of
data.
Insight into the customer journey between digital and retail experiences can often be fragmented
and such was the case for Al-Futtaim Automotive (AFA) in early 2017. AFA sought to bring their offline and
online data sets together to better understand the customer experience and tailor their campaign and sales
efforts accordingly.

Big Data, Bigger Challenges

Big Data has big challenges and the problem starts at its source. The key to understanding these challenges


is to get the data to work for its users, rather than getting the users to work to get the meaningful data
and insights.

Identified Challenges

How to better support customers when visiting showrooms by providing reliable customer insight to the
sales persons.

How to identify actionable insights for informed marketing communications relevant to the customers
to aid their final decision making.

How to connect and streamline data scattered across channels and link it to a single platform for all
stakeholders and their relevant decision makers.

Infusing UX into Data Visualisation

Most Data Experience projects start and end with technology or the tool used to
visualise the data. For our approach we took a more overarching approach, wearing our UX Design hats
to infuse our UX practice into understanding the users, their data needs and visualising relevant
patterns for a better understanding, ultimately ensuring better decision making.

Making Data Work for Actionable Insights

To innovate the existing approach of marketing vs sales analytics, we sought to aggregate and connectdata sources from each business process to show a unified view of the customer journey.


We introduced AFA to the concept of Predictive Data Modelling to predict customer behaviour through
historic data – this was achieved through acquisition and the use of the Alteryx analytics platform.


We exercised creativity in how these insights were presented. Tableau was used to present
specifically designed dashboards for the best possible adoption of these insights.

Data Visualising the Experience

Designing for this was as challenging as it was to slice and dice the data. The approach was to make
the data stand-out and not let the UI lead users.


The User Centric approach meant that pages and journeys were designed to match these actual users and
their needs from this data.


Even the chart types were carefully selected to keep the congnitive load minimal.

KEY DETAILS

API Development for GA accounts

API development from 12 Google Analytics accounts (digital media performance), Fastrack (showroom and salesperson performance) and SAP Hybris (email and SMS campaigns) to draw all data into Alteryx as core ETL platform to unify and cleanse data sets

Validating The Lead Generation

Determine which leads generated had the highest probability of converting to a sale and prioritise incoming leads to showroom and the salesperson to increase closure rates.

Single-sign-on experience

We used a a third-party utility called Okta; another work-around to retain the AFA branded experience and white label the Tableau login

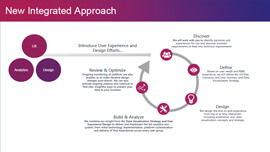
Advanced use of Alteryx

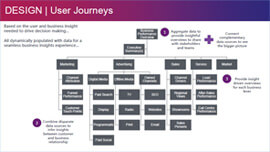
We designed capabilities to determine core customer pathways from online website behaviour to lead generation to test-drive and onto final sales.

Determine which campaign (or combination of campaign interactions) resulted in sales and share findings to the advertising agency for digital media optimisation and increase online conversion rates

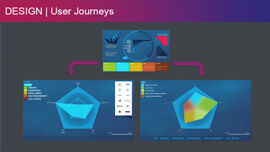
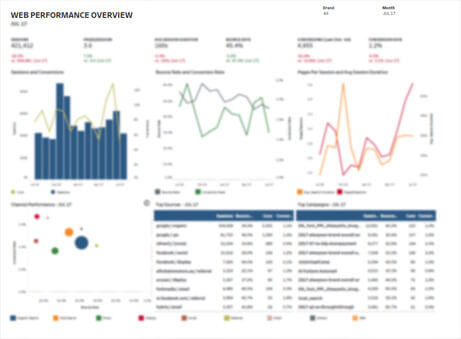
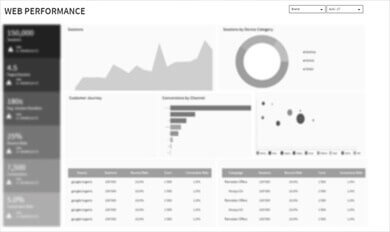
Interactive Dashboards

Delivery of results via interactive Tableau dashboards for continuous insights with weekly refreshed data and an engaging way to socialise data across showroomsDelivery of results via interactive Tableau dashboards for continuous insights with weekly refreshed data and an engaging way to socialise data across showrooms

Row-level Permissions

We made sure each user received the relevant and contextual data across the brand and management team. To ensure the Group can see all brands, whilst each brand only had the visibility of the data specific to them

Measurable Results

Not only has the program driven a considerable increase in sales and revenue for 2017,
unifying data across traditionally siloed business functions has brought increased appreciation of
digital marketing efforts.

193%

Increase in revenue from organic traffic (on top of + 414 % increase YOY in 2015)

213%

Increase in Transactions from organic visits (on top of + 501 % increase YOY in 2015)

26%

Increase in conversion rate from organic visits (on top of + 25 % YOY increase in 2015 the previous year)